It’s another Observer Votemeter, this time for the US elections. Are you closer to Kamala Harris or Donald Trump? Is each of the candidates, economically, more right-wing or left-wing? Are you more progressive or conservative? How much do you agree with each of the candidates on taxes, abortion laws or immigration? These are some of the topics that the Eleições Americanas 2024 Votometer allows you to explore.
With the scientific coordination of Jorge M. Fernandes, Ramón y Cajal fellow from the Institute of Policies and Public Goods of the CSIC, Madrid, and Mafalda Pratas, doctor in Political Science from Harvard University, in the United States, and designed by the team of programming From Observador, this interactive tool (web and mobile) allows readers to understand which candidates are closest to their values based on their positioning in relation to 16 statements.
To help explain exactly how this new Votometer works, how to participate and what methodology guided the development of the platform and what kind of results to expect, we have prepared a series of questions and answers.
What is the Votometer?
It is a free and intuitive electoral reflection tool, inspired by other scientifically validated platforms such as the European euandi and the German wahl-o-mat. The objective is to promote political debate and literacy.
What is the advantage of participating?
One of the main objectives of Votómetro is to increase the political competence of citizens. Therefore, you want to help them quickly acquire a set of information about the candidates’ positioning compared to their own position. Citizens do not read all the programs, statements and interviews of the candidates, so what this type of platform does is organize the information. In Votómetro you have a reasoned explanation of the classification of each candidate, which allows you to learn more about each position.
Is the platform independent?
Yes. The Votometer is completely independent.
How to participate?
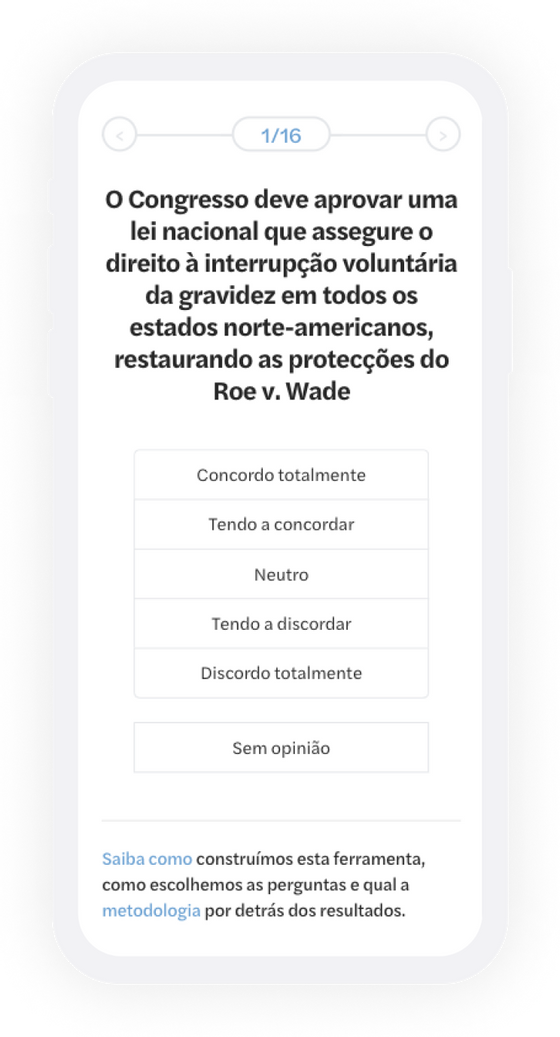
Simply enter the 2024 US Election Votemeter and choose the “Start” button. The test begins immediately, presenting the first of 16 sentences for the user to position their level of agreement in relation to it. You have six options: “Strongly agree,” “Tend to agree,” “Neutral,” “Tend to disagree,” “Strongly disagree,” and “No opinion.”

Do I need to register to respond?
It is not necessary to register as a user. You can start responding immediately.
Is participation on the platform anonymous?
Yes, participation is anonymous. No one will have access to your answers. Even if you are a voluntarily registered user of the Observador website or our subscriber, the response data in the tool is not associated with your user.
Do I need to pay to participate?
No. Using the tool is free.
What types of questions are asked?
There are 16 statements on classic topics, such as voluntary termination of pregnancy, and more current topics, such as conflicts in Ukraine and the Middle East.
How does participation work on the platform in general?
It works in two phases and intuitively. First, the level of agreement of the 16 sentences presented is answered. Then, a greater or lesser weight can be given to each of these 16 statements, to analyze the level of importance of each topic presented – and then compare it with that of each candidate. Anyone who wants can skip the consideration and go directly to the final results.
How does the response to statements work?
16 phrases related to political issues that define the different candidates are presented sequentially. In this stage, users are challenged to respond to their level of agreement with each of these statements by choosing one of the six options already mentioned: “Strongly agree”, “Tend to agree”, “Neutral”; “I tend to disagree”, “Strongly disagree” and “No opinion”. This methodology is called the Likert Scale – named after the North American sociologist who developed it – and is widely used to reliably measure behaviors and opinions, with a higher level of nuance, going beyond yes or no, since they specify the level of agreement.
How does the response to weights work?
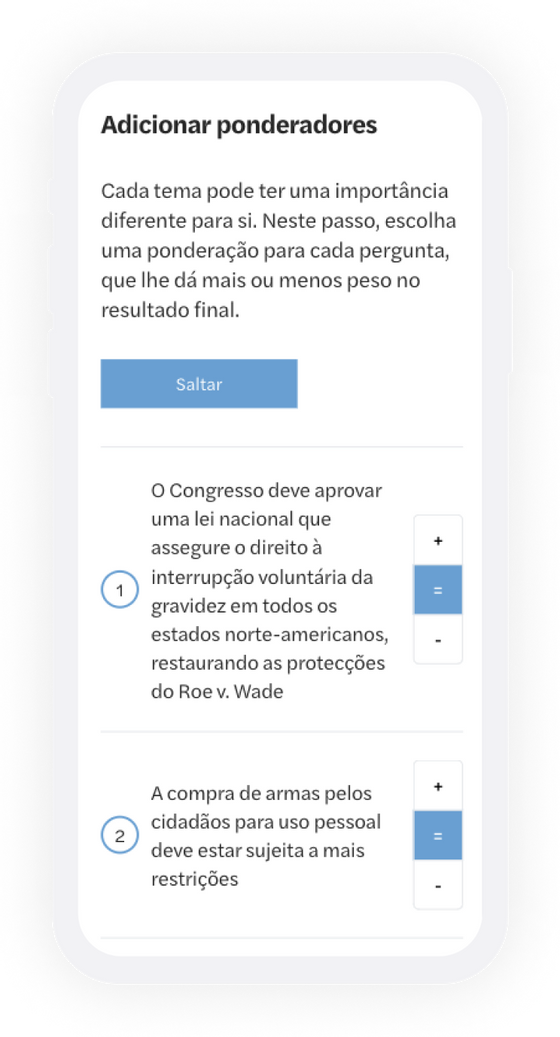
After answering all 16 statements, you will reach the “Add Weights” section, where all 20 statements are listed on the same page. At the end of each of these statements, the user can choose to consider how important each of them is to them: greater (+), lesser (-), or equal (=) weighting. Alternatively, you can skip that section. If you skip you are saying: everyone is equally important.

In the end, what kind of results do you get?
The results are presented in two detailed perspectives: “Correspondence” (political) and “Compass” (two-dimensional: economic left/economic right, progressive/conservative).
What can I find out in the “Correspondence” section?
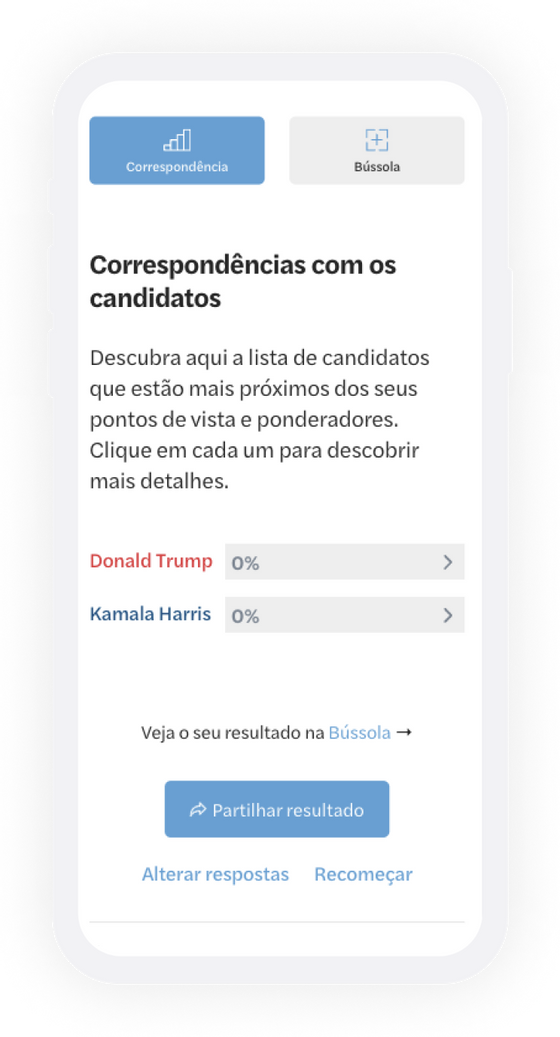
“Correspondence” shows, in percentage order, the respondent’s connection to each candidate, with a horizontal bar graph. This highlights political proximity, according to points of view, values and priorities. If the user selects the color bar for each candidate from the chart list, they will have access to a new informational section, layered with all 16 responses in detail, relating what they answered to the candidate’s position in relation to that statement. For each of these statements, there is even more information about them, leading to the source from which this position/statement of the analyzed candidate was taken.

What can I find in the “Compass” section?
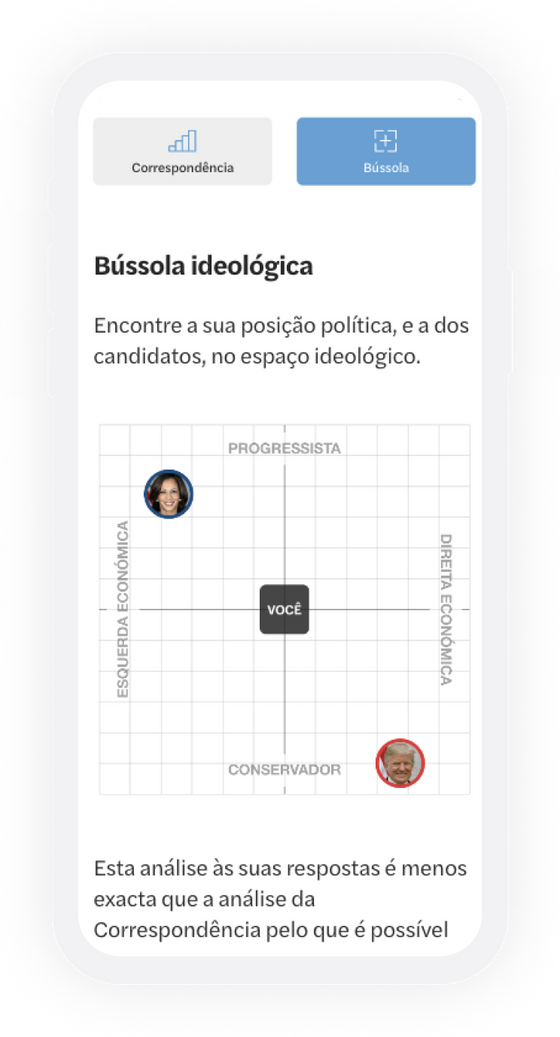
The “Compass” is a graphic that highlights the user’s positioning on a two-dimensional ideological basis. On the one hand, the horizontal axis identifies the left-right economic dimension. On the other hand, the vertical axis identifies the cultural dimension, considering progressive and conservative positions.

What was the methodology to arrive at the statements?
The platform positions candidates and shows which source supports this positioning. These statements were extracted from electoral programs, interviews and statements.
Can I change my answers and weightings?
Yes. In this phase of analyzing the results, the user has the option to “change answers” and analyze how this would influence the results.
Can I respond again?
Yes. Simply return to the platform home page.
Can I share the results?
Yes. If you want to share the results, simply select that option. You can do it either through a hyperlink that is generated, by email, or through the social networks Facebook, Twitter, LinkedIn and WhatsApp. The decision to share is exclusively yours.
It is possible to explore the results from the “Correspondence”, with 16 questions, and the “Compass”, with 2 dimensions. Is this assessment simplistic?
The “Compass” is a general idea and less exact from the positioning point of view, but very intuitive, explains Jorge Fernandes. If we wanted to carry out an absolutely rigorous analysis, a much more complex measurement would have to be made and it would be very difficult to capture in a simple way. Votometer is just an initiative to support reflection.
When a “neutral” position is chosen for the 16 statements, the result gives a match of 59% for Kamala Harris and 50% for Donald Trump. How should this be interpreted?
This is a technical question and has an explanation that arises purely from mathematical calculation. In the “Correspondence” section, the distance between a user’s position on a question and the candidate’s position on that same question is calculated. That is, it calculates the extent to which the user and candidate positions overlap. If, for example, a candidate answers “Tends to…” more often, someone who always answers “Neutral” will have a greater overlap with them.
There is an important detail: answering “Neutral” to all the questions does not mean that the person is from the political “center” or that they are a more moderate voter.
It is also necessary to keep in mind that the platform is not designed for people to choose all the “Neutral” answers, but rather to genuinely position themselves in relation to each question. If a user wants to answer “Neutral” to all questions, there will be no point in taking the survey.
This platform is designed in accordance with international best practices and similar to the platforms created in the context of the “euandi” project, more specifically in accordance with the methodology described in the document that can be consulted here.
Source: Observadora
