William Stanley Jevons, an English economist, was the first to respond, long before the symptoms appeared, to the question of coal exhaustion in the United Kingdom. In The coal question (1865), sketches the future history of British coal, correctly estimating that production could not continue much beyond another century.
In the case of oil, the evolution and consequent decline were studied by Marion King Hubbert, an American geophysicist who worked for Shell and who in 1956 published Nuclear power and fossil fuels, where he develops a quantitative hypothesis for the production cycle of mineral resources: the (Gaussian) bell curve. A symmetrical curve in which growth is followed by a peak and finally a decline. His study correctly described the cycle of oil exploration in the US for half a century, until the turbulent arrival of shale oil gave rise to a new cycle.
The Hubbert curve is symmetric, however, if we think in terms of the energy required to produce a barrel of crude oil (which increases as the resource decreases), there are reasons to think that in certain cases the curve may be skewed. , with the descent much faster than the ascent.
Hubbert’s ideas were generally conveniently forgotten in the period of optimism that followed the oil shocks of the 1970s, and rediscovered in the late 1990s by British geologist Colin Campbell, in what became known as “Peak Oil”. This movement had a great international repercussion, but it also fell into oblivion. Such memories and forgetting may explain why, decade after decade, the phrase “oil lasts another 60 years at current production levels” is repeatedly heard. And everyone calms down, because they heard the same thing 10, 20 and 30 years ago.
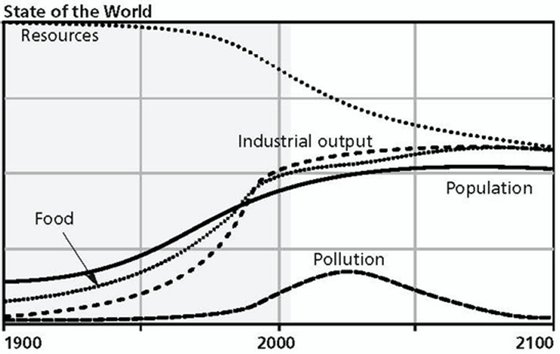
More generally, the problem of long-term global evolution was the subject of quantitative study in the early 1970s. Following the creation of the Club of Rome, a group at MIT led by Dennis Meadows published The limits of growth (1972). In this, a model is developed, based on the work of Jay Wright Forrester (the founder of the “System Dynamics” method), which allows us to observe the temporal evolution (from 1900 to 2100) of the interrelation of 5 factors that determine and limit growth of the planet: population, agricultural production, industrial production, consumption of non-renewable natural resources and pollution.
Two updates followed. The first, beyond the limits (1992), and finally The Limits to Growth: The 30 Year Update (2004).
With the model, which became known as World3, they considered several scenarios, of which we highlight five here: scenarios 1, 2, 6, 9 and 10 (in the 2004 edition).
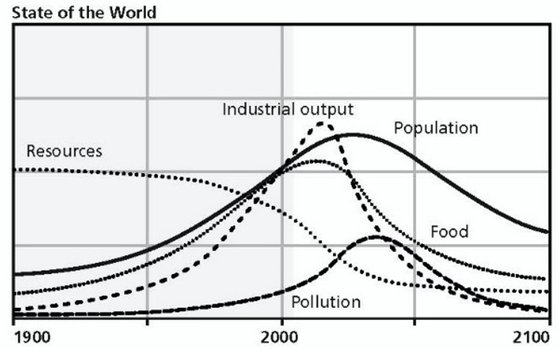
Scenario 1 (crisis of non-renewable resources): represents the case in which the world continues on the path followed during most of the 20th century. The result is an exponential growth of available food, industrial production and population, until the point at which rapidly diminishing resources force industrial production to decline (with a concomitant decline in agricultural production). Population and pollution continue to grow beyond the peak of industrialization, until finally the lack of food and services reduces the population.
Scenario 2 (pollution crisis): What happens if resource reserves are higher than initially estimated? This scenario differs from the previous one only in the initial amount of resources, which is doubled. This does not prevent the collapse, now mainly induced by the intense increase in pollution. High levels of industrial production are accompanied by high levels of pollution, which in turn have effects on soil fertility and erosion, leading to decreased food production and consequent population decline.
Scene 1
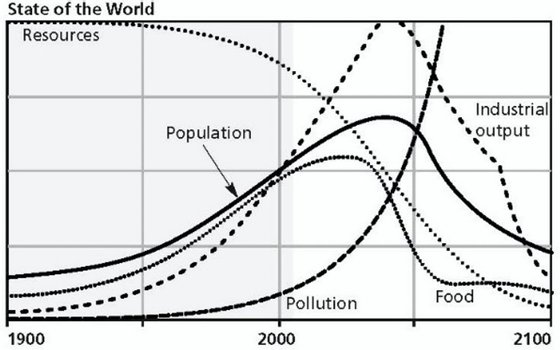
scenario 2
It should be noted that both food and industrial production, especially in the case of scenario 2, decreased faster than they grew (asymmetry of the curves). What the Italian chemist Ugo Bardi calls the Seneca effect (“the road to ruin is fast”, Seneca wrote to his friend Lucílio) The Seneca effect (2017).
Although the authors do not want to specify the moment in which industrial and food production reaches its peak, and its subsequent collapse, both the 1972 version and the 2004 corrected version of scenario 1 indicate that the global collapse will occur between 2015 and 2025.
If these scenarios are to be believed, regardless of the exact date of the spike, there are two ways to avoid the collapse. Or if you act in the feedback negative: depletion of natural resources, increased pollution, hunger; or about the feedback positive: exponential growth of population and physical capital (goods and services).
Scenario 6 (cost crisis) – The first is a technological path, the one that governs current policies and sensitivities: combating pollution, increasing agricultural productivity, protecting against soil erosion, energy efficiency and recycling. It is the solution for those who believe in perpetual growth. The model considers an annual rate of improvement of the technological solution and a time lag between discovery in the laboratory and its effective practical implementation.
Let’s see what happens starting from scenario 2 and introducing these measures one by one. Reducing pollution from all sources, while maintaining the previous doubling of energy, also leads to collapse, now triggered by food shortages. If we add to this measures to increase agricultural productivity, the collapse comes from soil erosion. The attempt to combat this latter phenomenon, using better agricultural techniques, is also collapsing, now due to an almost simultaneous combination of resource, food and high cost crises. Finally (scenario 6), adding an efficiency program in the use of non-renewable resources makes it possible to maintain an acceptable standard of living until later, but the supply of goods and services per capita (not shown in the figure) begins to decrease. fall with industrial production declines and the system collapses, fundamentally due to a cost crisis.
From the simulations with purely technological measures, an equilibrium solution for the system is not obtained.
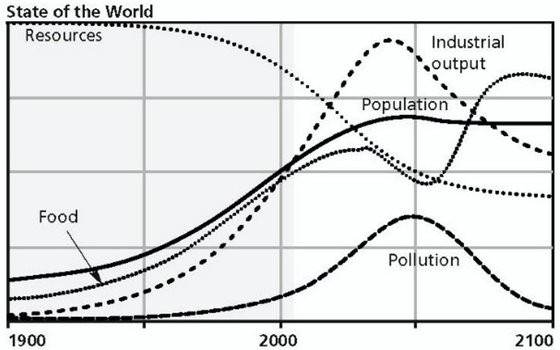
Scenario 6
The second way attacks the structural causes of exponential growth, seeking to stabilize the growth of population and physical capital. Regarding the population, contraceptive methods are available and the (average) number of children per family is limited to two. For physical capital, a level of industrial production per capita is set that is 10% higher than that of the year 2000, acting simultaneously on the investment rate and the capital depreciation rate. The simulations were carried out starting from scenario 2 and successively introducing these two types of structural measures. But, as in the case of exclusively technological measures, acting only on population growth and industrial production does not lead to the stabilization of the system.
Scenario 9 (stability) – Only by combining structural measures with technological measures, it was finally possible to obtain results that represent a system close to equilibrium and with reasonably high values of industrial and food production.
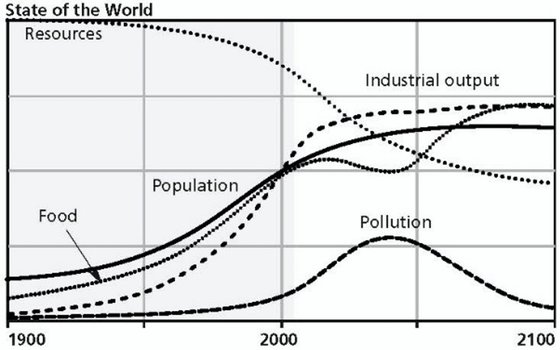
Scenario 9
Scenario 10
Scenario 10 (time is crucial) – In this scenario the same measures are taken as in scenario 9, but introduced 20 years earlier (in 1982 instead of 2002). The result is that, due to the stabilization of the population at a lower level, per capita values of food, services and consumer goods are obtained higher than those of scenario 9.
Studies were carried out comparing the predictions of the World3 model with real data, regardless of how they were obtained. A first: A comparison of The limits to growth with 30 years of reality (GM Turner, 2008) using results from 1972 and more recently: A comparison of The limits to growth with 30 years of reality (G. Branderhorst, 2020), comparing with the 2004 simulations.
In the first study, the scenario that best fit the data was scenario 1, followed by 6 (scenario 2 was not considered). In the second, scenarios 2 and 6 were the ones with the best fit, followed by 1, with scenario 9 being the furthest. Very generally, what these studies suggest is a world following a trajectory that is essentially the one it followed during the 20th century, mitigated by technological interventions, but without attacking the structural causes of exponential growth.
We may object that we have yet to see any “peaks,” either in oil or in industrial production, and that the limit to growth, if any, takes the form of a soft landing rather than a crash. However, if we see that this peak is being reached, it means that the time for action has passed.
In a dynamic system many variables have a deferred action on others. And this time lapse, between the introduction of a change in one of the parameters and the consequences in others, has all the more serious effects the faster the changes to which the system is subjected. Added to this is the fact that, due to this time lag, we can exceed what demographers call “carrying capacity” (that is, the maximum population of a species that the ecosystem where it lives can support) before we realize bill. When this happens, a “natural” collapse occurs and, many times, the problem is aggravated because the time spent above it reduces the load capacity of the system. Whether we still have time remains to be seen.
I think that, sooner or later, the fundamental variables that economists consider: employment, capital, currency, interest rate, consumption, investment… will no longer have control over the state of affairs. The problem is broader and has to do with population growth and industrial production.
Growth, as a salvation from the great evils of the economy, cannot continue indefinitely. On the contrary, it is necessary to put a limit on it, to avoid collapse and guarantee reasonable levels of food and industrial production, reducing the use of non-renewable resources and maintaining a low level of pollution.
We are about to see if the collapse estimated between 2015 and 2025 is not happening. But chances are, if not now, it will be later. I don’t think renewable energy, in use, and the promises of green hydrogen and nuclear fusion are coming in time. Even because, if you believe the results of the model, technological solutions alone will not prevent collapse. They can delay it, but maybe not for long.
(An implementation of the World3 model can be obtained here)
Source: Observadora
